Kooha Kwon 권구하

A data scientist who is experiended in various fields of engineering, project management, and data analytics. In this website, you can find some of my personal/professional projects.
Personal Email: kwonkh0424@gmail.com
View My LinkedIn Profile
Geographic Analysis of Chinese Cities
Project description: Analyze the following geographical characteristics of Chinese cities:
- Employment Change due to Green Energy Transition
- Population Estimation of Chinese Prefecture-Level Cities
- Comparative Analysis of Chinese Cities
This project was in collaboration with the Center of Geographical Analysis (Harvard) to recreate the groundbreaking research papers using the KNIME platform.
1. Employment Change due to Green Energy Transition
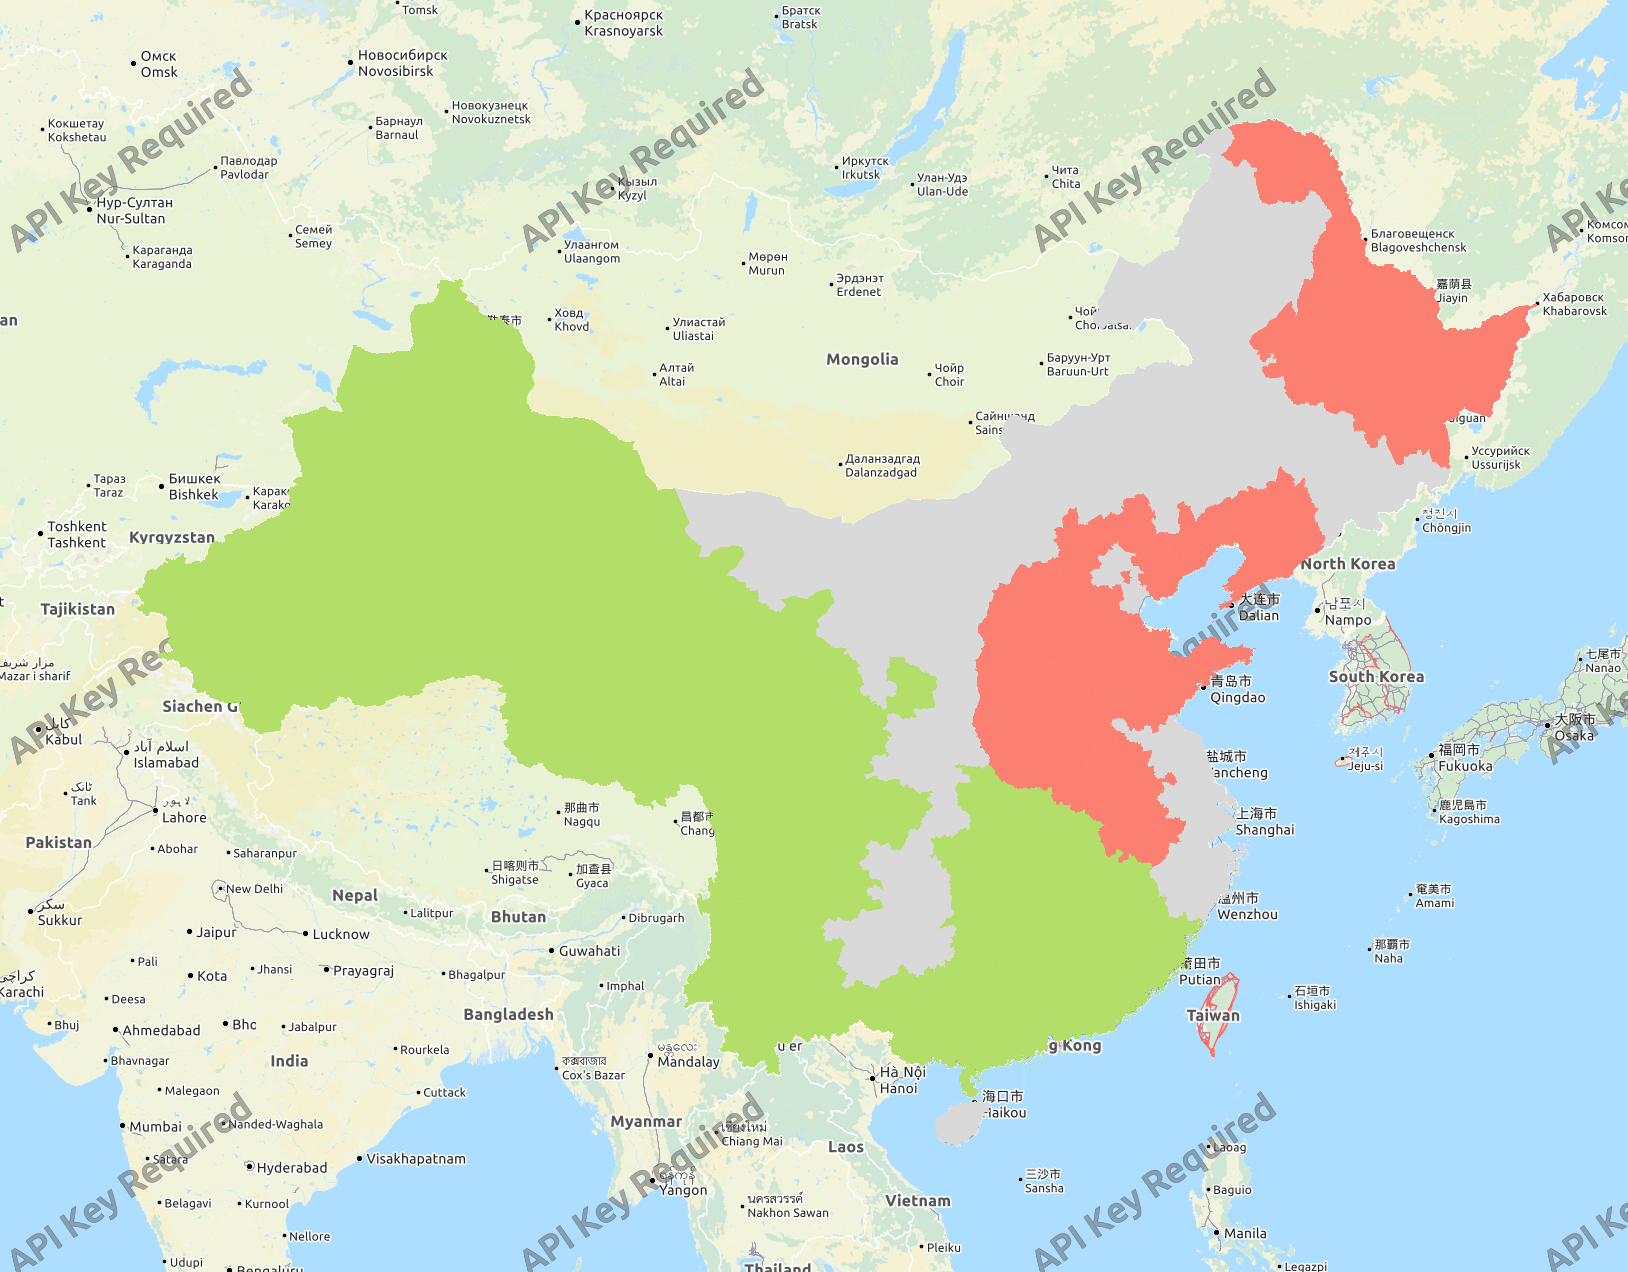
The Chinese government has declared that it will increase its reliance on green energy (wind, solar, geothermal, hydro, etc.). However, this rapid shift in energy sources will cause a dramatic change in the employment market throughout China. Utilizing the KNIME platform, total employment change is calculated for each Chinese province.
The script/calculation is based on the following article: Sara Hsu & Shelley Nauss (2009) Employment impacts of a ‘green’ energy transition in China, China Economic Journal, 2:2, 219-237, DOI: 10.1080/17538960903083533
Data were collected from All China Data Center
Output:
- Table: List of Provinces and their employment change according to different energy shift scenarios

- Color-coded Chinese Map based on employment change

Green: Regions with a significant increase in employment Gray: Regions with no significant change in employment Red: Regions with a significant decrease in employment
2. Population Estimation of Chinese Prefecture-Level Cities
Currently, Hukou survey is the system China utilizes to determine the population of each prefecture-level cities. However, this is a highly biased method that largely underpredicts the actual city population. By using methodology from the article cited below, estimation of the true Chinese population for each prefecture-level cities are calculated.
The script/calculation is based on the following article: Bettencourt LMA and Lobo J (2019) Quantitative Methods for the Comparative Analysis of Cities in History. Front. Digit. Humanit. 6:17. doi: 10.3389/fdigh.2019.00017
Data was collected from: All China Data Center and United States Census Bureau
Outputs:
-
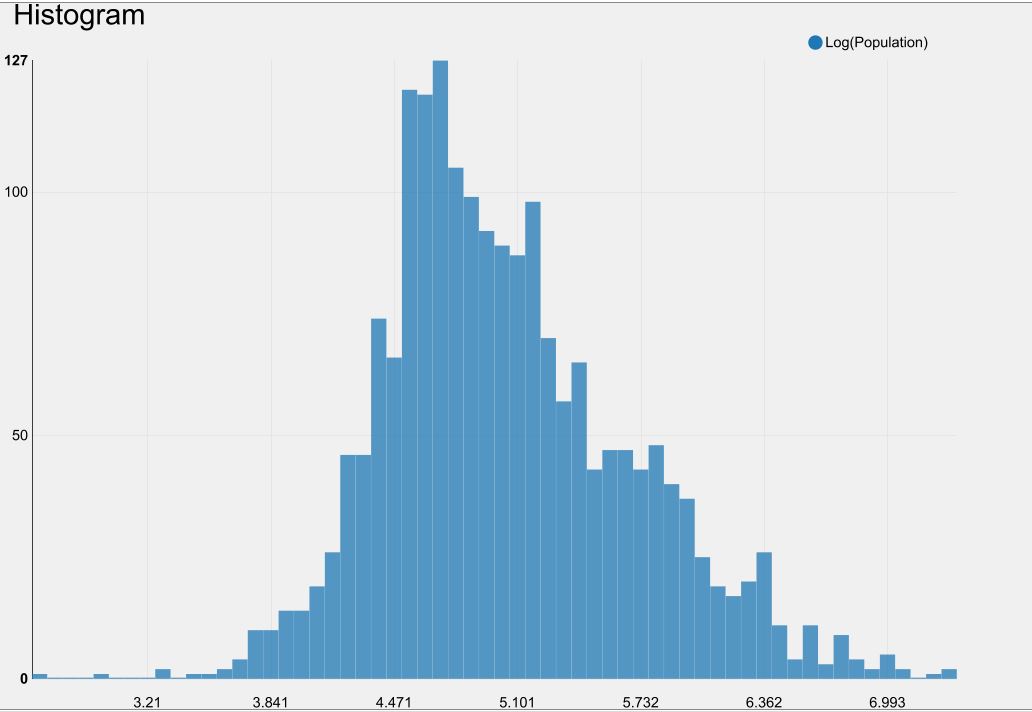
The city size distribution of USA (2010)
-
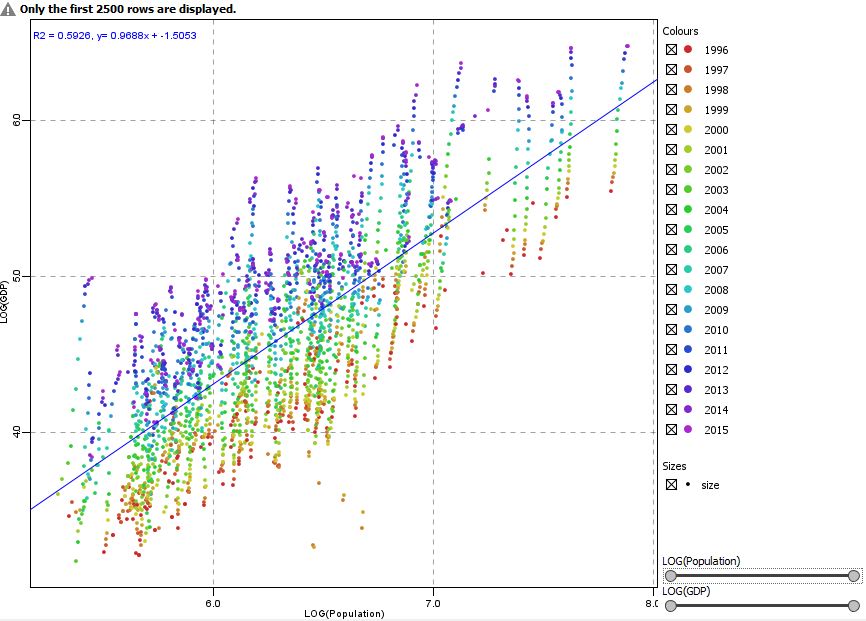
Economic and deomgraphic growth in modern Chinese cities (1998-2015)
3. Comparative Analysis of Chinese Cities
For ancient societies, there are a limited amount of information/data about their population size and GDP level. In order to estimate the ancient cities’ population, we could take a lot into different variables of settlements that are available to us. One of the most available measurements of the early settlements is the city size/boundaries. In order to prove that a city population could be driven by city size, urban city data of the U.S. and China utilized.
The script/calculation is based on the following article: Zünd D, Bettencourt LMA (2019) Growth and development in prefecture-level cities in China. PLoS ONE 14(9): e0221017. https://doi.org/10.1371/journal.pone.0221017
Data was collected from: All China Data Center
Outputs:
-
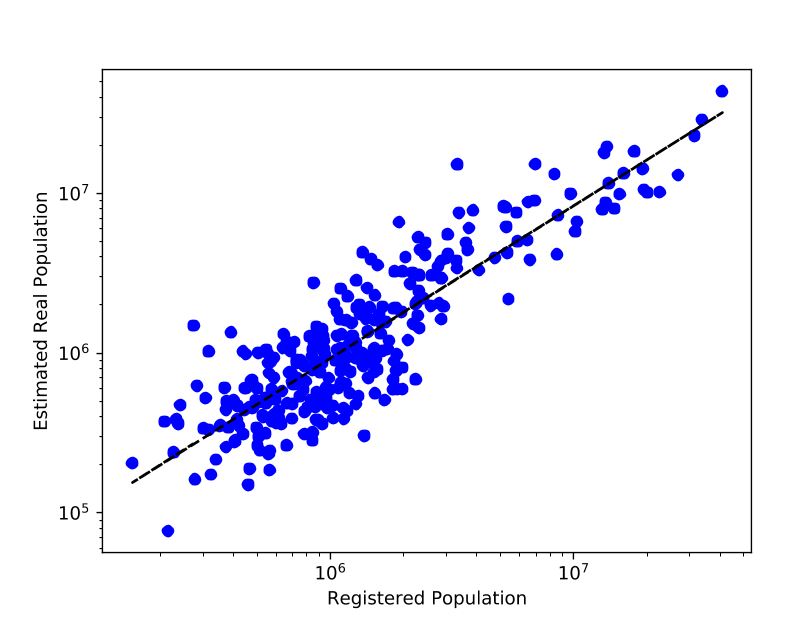
Estimated vs. Resident Population of Prefecture-Level Cities
-
Estimation Error (Residual) of Prefecture-Level City Population
Red=Underestimation
Blue=Overestimation


